July Market Commentary
Everything is Different Now
June Recap and July Outlook
June saw a further complication of the macro situation as U.S. military involvement in Iran was added to ongoing tariff confusion and a worsening of the economic outlook for the balance of 2025 and into 2026. The announcement that a new Fed Chairperson would soon be named essentially created a shadow Fed Chair, increasing the potential for conflicting policy signals that could destabilize markets. If that wasn’t enough, the month also saw the progress through Congress of the “Big, Beautiful Bill” that will potentially massively increase the deficit and a very public breakup between the richest man in the world and the most powerful one.
Somewhat surprisingly, both the bond and the equity markets took headlines and data releases in stride, and both turned in positive performance.
Have investors reached a level of apathy after months of not knowing where to look next, given the cascade of inputs? Or is news cycle exhaustion creating a very strong case of “see you in September?”
Let's get into the data:
- Inflation, as measured by CPI, rose less than expected. For the 12 months ended in May, CPI was 2.4%. The monthly number rose 0.1%.
- Non-farm payrolls for June came in at 147,000. The U.S. Bureau of Labor Statistics reported that the labor market added significantly more than the 110,000 jobs that were expected, and the unemployment rate fell to 4.1%.
- The U.S. dollar index has declined by more than 10%. Against a basket of other currencies, the U.S. dollar index hit a three-year low, after peaking on inauguration day.
- GDP expectations were lowered. The Fed’s “dot plot” showed GDP for 2025 falling to 1.4% from 1.7% in March, and 2026 GDP expectations at 1.6% from 1.8%.
What Does the Data Add Up To?
Stable inflation and a solid labor market have likely taken interest rate cuts off the table until Q4. Despite dire projections of the havoc tariff policy will wreak on the economy, meaningful, measurable data isn’t showing meaningful damage yet. The lack of a visible impact from tariffs so far, specifically with regards to inflation, may be due to businesses not passing on higher import prices to customers. The massive pre-tariff inventory build-up earlier in the year has possibly provided a cushion for businesses to maintain pricing levels, at least until the expected – and touted – tariff deals become a reality.
Markets are forward-looking, and tend to price in future expectations. It’s becoming normal for investors to look beyond the volatility that the administration maintains is part of a negotiating strategy and assume that tariffs will be higher, but manageable, when the dust settles.
The balance of the year may be a story of volatility in the form of a “choppy” stock market that has potential to maintain momentum; a Federal Reserve that ends the year with lower rates, but takes longer to get there, and an economy that chugs along.
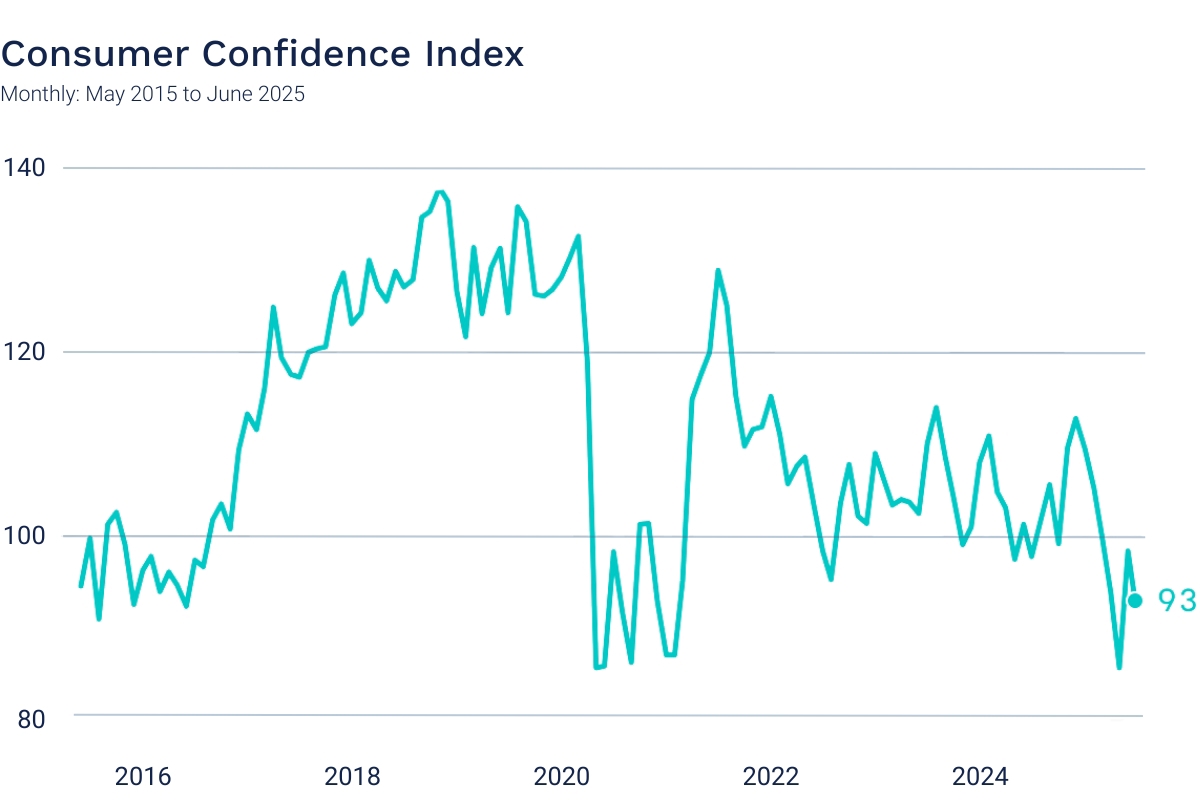
Chart of the Month: Consumer Pessimism Returns
After a “relief spike” when tariffs were rolled back in May, consumer confidence turned negative again. Consumers of all age groups cited less job availability, worse income prospects, inflation and high prices in their read of the economy.
Equity Markets in June
- The S&P 500 was up 4.96% for the month
- The Dow Jones Industrial Average gained 4.32% for the month
- The S&P MidCap 400 rose 3.38% for the month
- The S&P SmallCap 600 increased 3.85% for the month *Source: S&P Global. All performance as of June 30, 2025.
Nine of the eleven S&P 500 sectors had positive returns, with Information Technology maintaining the lead for the third month in a row, up 9.73% and Consumer Staples in last place, down 2.21%. The Magnificent Seven added 47% of the index return of 5.09%. Monthly intraday volatility, measured as the daily high/low, decreased again, to 0.83%, but is still historically high.
Bond Markets in June
The 10-year U.S. Treasury ended the month at a yield of 4.24%, down from 4.40% the prior month. The 30-year U.S. Treasury ended June at 4.78%, up from 4.92%. The Bloomberg U.S. Aggregate Bond Index returned 1.54%. The Bloomberg Municipal Bond Index returned 0.62%.
The information contained herein is intended to be used for educational purposes only and is not exhaustive. Diversification and/or any strategy that may be discussed does not guarantee against investment losses but are intended to help manage risk and return. If applicable, historical discussions and/or opinions are not predictive of future events. The content is presented in good faith and has been drawn from sources believed to be reliable. The content is not intended to be legal, tax or financial advice. Please consult a legal, tax or financial professional for information specific to your individual situation.
This content not reviewed by FINRA
Disclosure information
The strategies discussed are strictly for illustrative and educational purposes and should not be construed as a recommendation to purchase or sell, or an offer to sell or a solicitation of an offer to buy any security. There is no guarantee that any strategies discussed will be effective. The information provided is not intended to be a complete analysis of every material fact respecting any strategy. The examples presented do not take into consideration commissions, tax implications, or other transactions costs, which may significantly affect the economic consequences of a given strategy. The information provided is not intended to be a tax advice. Investors should be urged to consult their tax professional or financial advisers for more information regarding their specific tax situations.
Featured News & Insights

- 2026 Global Market Outlook
- December Market Commentary
- November Market Commentary
- October Market Commentary
- September Market Commentary
- July Market Commentary
- 5 Smart Investment Moves During Market Downturns
- Preparing for 2024 Tax Filing: A Comprehensive Roadmap to Your Tax Documentation
- A New Regime Comes Into Focus
- Important New Filing Requirement for Entity involvement
- Property Alert Services
- You are being targeted by Search engine optimization (SEO) scams.
- Navigating the Tax Maze: A Comprehensive Guide to Documenting Your 2023 Tax Return
- December Market Commentary Rates: Lower and Sooner?
- What Issues Should I Consider Before The End Of The Year 2023
- A Raft of Reassuring Data – or Not?
- Guarding Your Financial Future: The Power of Credit Freezing
- Deglobalization and Dedollarization
- Debt Deadlines, Defaults and Downgrades
- What Issues to Consider as my child becomes independent
- Estate Planning
- Tax Season Help Has Arrived
- 2023 Outlook
- Inflation Impacts
- Should a Trust Be Part of Your Estate Plan?
- How to Have “The Talk” With Your Aging Parents
- The psychology of retirement
- The Optimal Retirement Withdrawal Plan
- Avoiding the Big Mistake
- The Overlooked Key to Estate Planning Success: The Psychology of Communication
- Higher and Faster: The Fed Turns Up the Heat
- Taxes FAQ 2022
- Four Steps to Cope with Market Madness
- The Russian Invasion of Ukraine
- Five Questions to Ask Before Investing in Crypto
- April 2021 Newsletter
- 5 Tips for loving life in tough economic times
- Once Again, It’s the End of the World
- Are Investors Their Own Worst Enemy?
- Charitable Giving: Beyond the Basics
- 2019…And the Plot Thickens
- Oil Falls, Dollar Rises, Stocks Get Confused